

China Waste to Energy Market Growth, Trends, Share, Size, Revenue and Future Outlook 2033
China Waste to Energy Market Growth, Trends, Analysis, Size- By Technology, By Waste Type, By Application- Regional Outlook, Competitive Strategies and Segment Forecast to 2033
| Published: May-2023 | Report ID: POAE2328 | Pages: 1 - 104 | Formats*: |
| Category : Power & Energy | |||
| Report Metric | Details |
| Market size available for years | 2019-2033 |
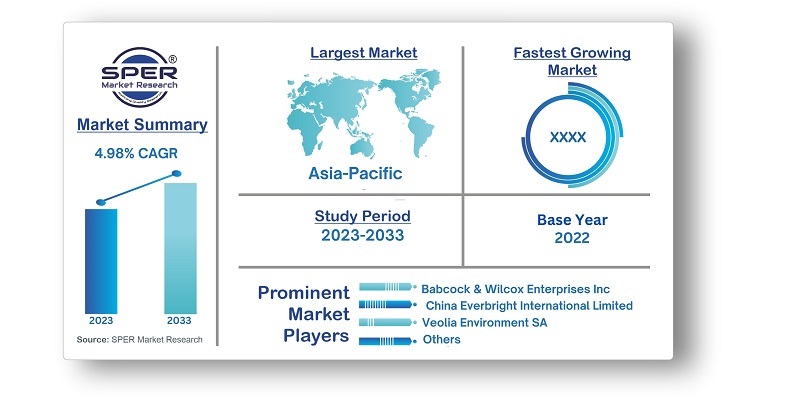
| Base year considered | 2022 |
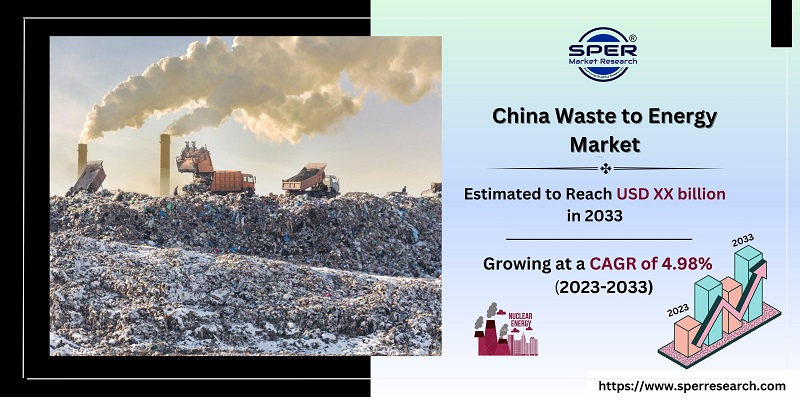
| Forecast period | 2023-2033 |
| Segments covered | By Technology, By Waste Type, By Application |
| Regions covered | Northern Region, Southern Region, Eastern Region, Western Region. |
| Companies Covered | Babcock & Wilcox Enterprises Inc, China Everbright International Limited, Covanta Holding Corporation, Veolia Environment SA, Zheneng Jinjiang Environment Holdings Co Ltd. |
- Waste management Companies
- Energy Companies
- Industrial facilities
- Governments
- Municipalities
- China Waste to Energy Market Value Share and Forecast, By Technology, 2023-2033
- Thermochemical
- Biochemical
- China Waste to Energy Market Value Share and Forecast, By Waste Type, 2023-2033
- Municipal Solid Waste
- Process Waste
- Agriculture Waste
- Others
- China Waste to Energy Market Value Share and Forecast, By Application, 2023-2033
- Electricity
- Heat
- North China
- Northeast China
- East China
- South Central China
- Southwest China
- China Waste to Energy Market Size (FY’2023-FY’2033)
- Overview of China Waste to Energy Market
- Segmentation of China Waste to Energy Market By Technology (Thermochemical, Biochemical)
- Segmentation of China Waste to Energy Market By Waste Type (Municipal Solid Waste, Process Waste, Agriculture Waste, Others)
- Segmentation of China Waste to Energy Market By Application (Electricity, Heat)
- Statistical Snap of China Waste to Energy Market
- Growth Analysis of China Waste to Energy Market
- Problems and Challenges in China Waste to Energy Market
- Competitive Landscape in the China Waste to Energy Market
- Impact of COVID-19 and Demonetization on China Waste to Energy Market
- Details on Recent Investment in China Waste to Energy Market
- Competitive Analysis of China Waste to Energy Market
- Key Players in the China Waste to Energy Market
- SWOT Analysis of China Waste to Energy Market
- China Waste to Energy Market Future Outlook and Projections (FY’2023-FY’2033)
- Recommendations from Analyst
1.1. Scope of the report1.2. Market segment analysis
2.1. Research data source2.1.1. Secondary Data2.1.2. Primary Data2.1.3. SPER’s internal database2.1.4. Premium insight from KOL’s2.2. Market size estimation2.2.1. Top-down and Bottom-up approach2.3. Data triangulation
4.1. Driver, Restraint, Opportunity and Challenges analysis4.1.1. Drivers4.1.2. Restraints4.1.3. Opportunities4.1.4. Challenges4.2. COVID-19 Impacts of the China Waste to Energy Market
5.1. SWOT Analysis5.1.1. Strengths5.1.2. Weaknesses5.1.3. Opportunities5.1.4. Threats5.2. PESTEL Analysis5.2.1. Political Landscape5.2.2. Economic Landscape5.2.3. Social Landscape5.2.4. Technological Landscape5.2.5. Environmental Landscape5.2.6. Legal Landscape5.3. PORTER’s Five Forces5.3.1. Bargaining power of suppliers5.3.2. Bargaining power of buyers5.3.3. Threat of Substitute5.3.4. Threat of new entrant5.3.5. Competitive rivalry5.4. Heat Map Analysis
6.1. China Waste to Energy Market Manufacturing Base Distribution, Sales Area, Product Type6.2. Mergers & Acquisitions, Partnerships, Product Launch, and Collaboration in China Waste to Energy Market
7.1. China Waste to Energy Market Value Share and Forecast, By Technology, 2023-20337.2. Thermochemical7.3. Biochemical
8.1. China Waste to Energy Market Value Share and Forecast, By Waste Type, 2023-20338.2. Municipal Solid Waste8.3. Process Waste8.4. Agriculture Waste8.5. Others
9.1. China Waste to Energy Market Value Share and Forecast, By Application, 2023-20339.2. Electricity9.3. Heat
10.1. China Waste to Energy Market Size and Market Share
11.1. China Waste to Energy Market Size and Market Share by Technology (2019-2026)11.2. China Waste to Energy Market Size and Market Share by Technology (2027-2033)
12.1. China Waste to Energy Market Size and Market Share by Waste Type (2019-2026)12.2. China Waste to Energy Market Size and Market Share by Waste Type (2027-2033)
13.1. China Waste to Energy Market Size and Market Share by Application (2019-2026)13.2. China Waste to Energy Market Size and Market Share by Application (2027-2033)
14.1. China Waste to Energy Market Size and Market Share by Region (2019-2026)14.2. China Waste to Energy Market Size and Market Share by Region (2027-2033)14.3. North China14.4. Northeast China14.5. East China14.6. South Central China14.7. Southwest China
15.1. Babcock & Wilcox Enterprises Inc.15.1.1. Company details15.1.2. Financial outlook15.1.3. Product summary15.1.4. Recent developments15.2. China Everbright International Limited.15.2.1. Company details15.2.2. Financial outlook15.2.3. Product summary15.2.4. Recent developments15.3. Covanta Holding Corporation15.3.1. Company details15.3.2. Financial outlook15.3.3. Product summary15.3.4. Recent developments15.4. Veolia Environment SA15.4.1. Company details15.4.2. Financial outlook15.4.3. Product summary15.4.4. Recent developments15.5. Zheneng Jinjiang Environment Holding Co Ltd.15.5.1. Company details15.5.2. Financial outlook15.5.3. Product summary15.5.4. Recent developments
SPER Market Research’s methodology uses great emphasis on primary research to ensure that the market intelligence insights are up to date, reliable and accurate. Primary interviews are done with players involved in each phase of a supply chain to analyze the market forecasting. The secondary research method is used to help you fully understand how the future markets and the spending patterns look likes.
The report is based on in-depth qualitative and quantitative analysis of the Product Market. The quantitative analysis involves the application of various projection and sampling techniques. The qualitative analysis involves primary interviews, surveys, and vendor briefings. The data gathered as a result of these processes are validated through experts opinion. Our research methodology entails an ideal mixture of primary and secondary initiatives.


Frequently Asked Questions About This Report
PLACE AN ORDER
Year End Discount
Sample Report
Pre-Purchase Inquiry
NEED CUSTOMIZATION?
Request CustomizationCALL OR EMAIL US
100% Secure Payment


Related Reports
Have a glance of the Report

Our Global Clients
Our data-driven insights have influenced the strategy of 200+ reputed companies across the globe.