

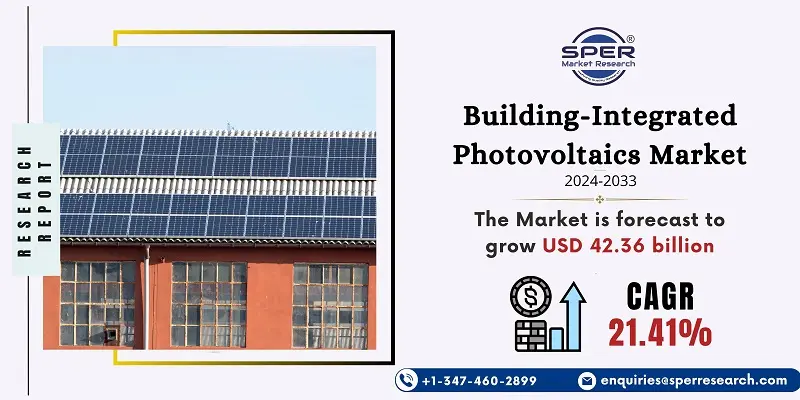
Building Integrated Photovoltaics Market Growth, Size, Trends, Demand, Share and Future Outlook
Building Integrated Photovoltaics Market Size- By Product Type, By Application, By End User- Regional outlook, Competitive Strategies and Segment Forecast to 2033
| Published: Aug-2024 | Report ID: POAE2478 | Pages: 1 - 232 | Formats*: |
| Category : Power & Energy | |||
- July 2023; the U.S. Division of Energy (DOE), as a feature of President Biden's Putting Resources into America plan, in the principal seven-day stretch of July has uncovered USD 45 million, including USD18 million from the Bipartisan Foundation Regulation, to back guide assembling of sun-based parts that can add to a homegrown assembling area fit for meeting the Organization's sun powered portion objectives without depending on imported items. The speculation will likewise back the improvement of newly utilized sun-powered innovations, such as, building-coordinated photovoltaics and agrivoltaics, to create new business sectors for American items.
| Report Metric | Details |
| Market size available for years | 2020-2033 |
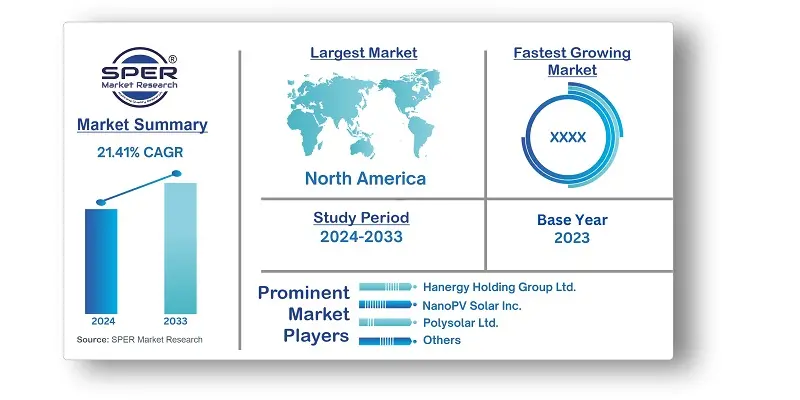
| Base year considered | 2023 |
| Forecast period | 2024-2033 |
| Segments covered | By Product Type, By Application, By End-Use |
| Regions covered | Europe, North America, Asia Pacific, Middle East, Africa and Latin America. |
| Companies Covered | Ankara Solar AS, Ertex Solartechnik GmbH, Hanergy Holding Group Ltd., Hermans Techniglaz, ISSOL sa, NanoPV Solar Inc., Navitas Green Solutions Pvt. Ltd., Polysolar Ltd., Sphelar Power Corporation and Viasolis. |
- Architects and Designers
- Building Owners and Developers
- Construction Companies
- Real Estate Developers
- Government Agencies and Regulators
- Facility Managers
| By Product Type: |
|
| By Application: |
|
| By End-Use: |
|
- Global Building-Integrated Photovoltaics Market Size (FY’2024-FY’2033)
- Overview of Global Building-Integrated Photovoltaics Market
- Segmentation of Global Building-Integrated Photovoltaics Market by Product Type (Polycrystalline, Thin Film, Others)
- Segmentation of Global Building-Integrated Photovoltaics Market by Application (Roof, Facades, Glass, Others)
- Segmentation of Global Building-Integrated Photovoltaics Market by End-Use (Commercial, Residential, Industrial)
- Statistical Snap of Global Building-Integrated Photovoltaics Market
- Expansion Analysis of Global Building-Integrated Photovoltaics Market
- Problems and Obstacles in Global Building-Integrated Photovoltaics Market
- Competitive Landscape in the Global Building-Integrated Photovoltaics Market
- Impact of COVID-19 and Demonetization on Global Building-Integrated Photovoltaics Market
- Details on Current Investment in Global Building-Integrated Photovoltaics Market
- Competitive Analysis of Global Building-Integrated Photovoltaics Market
- Prominent Players in the Global Building-Integrated Photovoltaics Market
- SWOT Analysis of Global Building-Integrated Photovoltaics Market
- Global Building-Integrated Photovoltaics Market Future Outlook and Projections (FY’2024-FY’2033)
- Recommendations from Analyst
1.1. Scope of the report1.2. Market segment analysis
2.1. Research data source
2.1.1. Secondary Data2.1.2. Primary Data2.1.3. SPER’s internal database2.1.4. Premium insight from KOL’s
2.2. Market size estimation
2.2.1. Top-down and Bottom-up approach
2.3. Data triangulation
4.1. Driver, Restraint, Opportunity and Challenges analysis
4.1.1. Drivers4.1.2. Restraints4.1.3. Opportunities4.1.4. Challenges
4.2. COVID-19 Impacts of the Global Building-Integrated Photovoltaics Market.
5.1. SWOT Analysis
5.1.1. Strengths5.1.2. Weaknesses5.1.3. Opportunities5.1.4. Threats
5.2. PESTEL Analysis
5.2.1. Political Landscape5.2.2. Economic Landscape5.2.3. Social Landscape5.2.4. Technological Landscape5.2.5. Environmental Landscape5.2.6. Legal Landscape
5.3. PORTER’s Five Forces
5.3.1. Bargaining power of suppliers5.3.2. Bargaining power of buyers5.3.3. Threat of Substitute5.3.4. Threat of new entrant5.3.5. Competitive rivalry
5.4. Heat Map Analysis
6.1. Global Building-Integrated Photovoltaics Market Manufacturing Base Distribution, Sales Area, Product Type6.2. Mergers & Acquisitions, Partnerships, Product Launch, and Collaboration in Global Building-Integrated Photovoltaics Market
7.1. Global Building-Integrated Photovoltaics Market Size, Share and Forecast, By Product Type, 2020-20267.2. Global Building-Integrated Photovoltaics Market Size, Share and Forecast, By Product Type, 2027-20337.3. Polycrystalline7.4. Thin Film7.5. Others
8.1. Global Building-Integrated Photovoltaics Market Size, Share and Forecast, By Application, 2020-20268.2. Global Building-Integrated Photovoltaics Market Size, Share and Forecast, By Application, 2027-20338.3. Roof8.4. Facades8.5. Glass8.6. Others
9.1. Global Building-Integrated Photovoltaics Market Size, Share and Forecast, By End-Use, 2020-20269.2. Global Building-Integrated Photovoltaics Market Size, Share and Forecast, By End-Use, 2027-20339.3. Commercial9.4. Residential9.5. Industrial
10.1. Global Building-Integrated Photovoltaics Market Size and Market Share
11.1. Global Building-Integrated Photovoltaics Market Size and Market Share By Region (2020-2026)11.2. Global Building-Integrated Photovoltaics Market Size and Market Share By Region (2027-2033)11.3. Asia-Pacific
11.3.1. Australia11.3.2. China11.3.3. India11.3.4. Japan11.3.5. South Korea11.3.6. Rest of Asia-Pacific
11.4. Europe
11.4.1. France11.4.2. Germany11.4.3. Italy11.4.4. Spain11.4.5. United Kingdom11.4.6. Rest of Europe
11.5. Middle East and Africa
11.5.1. Kingdom of Saudi Arabia11.5.2. United Arab Emirates11.5.3. Qatar11.5.4. South Africa11.5.5. Egypt11.5.6. Morocco11.5.7. Nigeria11.5.8. Rest of Middle-East and Africa
11.6. North America
11.6.1. Canada11.6.2. Mexico11.6.3. United States
11.7. Latin America
11.7.1. Argentina11.7.2. Brazil11.7.3. Rest of Latin America
12.1. Ankara Solar AS
12.1.1. Company details12.1.2. Financial outlook12.1.3. Product summary12.1.4. Recent developments
12.2. Ertex Solartechnik GmbH
12.2.1. Company details12.2.2. Financial outlook12.2.3. Product summary12.2.4. Recent developments
12.3. Hanergy Holding Group Ltd.
12.3.1. Company details12.3.2. Financial outlook12.3.3. Product summary12.3.4. Recent developments
12.4. Hermans Techniglaz
12.4.1. Company details12.4.2. Financial outlook12.4.3. Product summary12.4.4. Recent developments
12.5. ISSOL sa
12.5.1. Company details12.5.2. Financial outlook12.5.3. Product summary12.5.4. Recent developments
12.6. NanoPV Solar Inc.
12.6.1. Company details12.6.2. Financial outlook12.6.3. Product summary12.6.4. Recent developments
12.7. Navitas Green Solutions Pvt. Ltd.
12.7.1. Company details12.7.2. Financial outlook12.7.3. Product summary12.7.4. Recent developments
12.8. Polysolar Ltd.
12.8.1. Company details12.8.2. Financial outlook12.8.3. Product summary12.8.4. Recent developments
12.9. Sphelar Power Corporation
12.9.1. Company details12.9.2. Financial outlook12.9.3. Product summary12.9.4. Recent developments
12.10. Viasolis
12.10.1. Company details12.10.2. Financial outlook12.10.3. Product summary12.10.4. Recent developments
SPER Market Research’s methodology uses great emphasis on primary research to ensure that the market intelligence insights are up to date, reliable and accurate. Primary interviews are done with players involved in each phase of a supply chain to analyze the market forecasting. The secondary research method is used to help you fully understand how the future markets and the spending patterns look likes.
The report is based on in-depth qualitative and quantitative analysis of the Product Market. The quantitative analysis involves the application of various projection and sampling techniques. The qualitative analysis involves primary interviews, surveys, and vendor briefings. The data gathered as a result of these processes are validated through experts opinion. Our research methodology entails an ideal mixture of primary and secondary initiatives.


Frequently Asked Questions About This Report
PLACE AN ORDER
Year End Discount
Sample Report
Pre-Purchase Inquiry
NEED CUSTOMIZATION?
Request CustomizationCALL OR EMAIL US
100% Secure Payment


Related Reports
Have a glance of the Report

Our Global Clients
Our data-driven insights have influenced the strategy of 200+ reputed companies across the globe.