Virtual Power Plant Market Growth, Size, Trends, Share, Revenue. Demand and Future Outlook
Virtual Power Plant Market Size- By Technology, By Vertical, By Source- Regional Outlook, Competitive Strategies and Segment Forecast to 2033
| Published: Feb-2024 | Report ID: POAE2419 | Pages: 1 - 234 | Formats*: |
| Category : Power & Energy | |||
- 2023: In Carwarp, AGL Energy Ltd. and RayGen inaugurated the largest next-generation long-duration energy storage facility in the world. This facility will increase the capacity and flexibility of the nearby electrical system in addition to providing synchronous power.
- 2022: Autogrid Systems Inc. collaborated with Mysa to create utility-scale virtual power plants that use smart thermostat technology for grid modernization.
-005035221022024.webp)
- Growing adoption of smart grids- The rising deployment of smart grids opens up new potential for the virtual power plant business by allowing for the integration and optimization of distributed energy resources (DERs). Smart grids are defined as the combination of power, communications, and information technology to improve the electric power infrastructure that serves loads while also allowing for the integration of distributed energy resources. DERs enable more modular, scalable, and flexible energy generation, and the smart grid facilitates their smooth integration at the transmission and distribution levels.
- Integration of various hardware and software components in VPP- The combination of various hardware and software components in VPPs presents a complicated set of technological hurdles. VPPs combine a variety of DERs, such as solar panels, wind turbines, and energy storage systems, which are often from different manufacturers and use separate communication protocols. It is difficult to coordinate these pieces such that they all operate together efficiently.
-005021721022024.webp)
| Report Metric | Details |
| Market size available for years | 2020-2033 |
| Base year considered | 2023 |
| Forecast period | 2024-2033 |
| Segments covered | By Technology, By Vertical, By Source |
| Regions covered | North America, Asia-Pacific, Latin America, Middle East & Africa and Europe |
| Companies Covered | ABB LTD., AGL ENERGY LIMITED, AUTOGRID SYSTEMS, INC., ENBALA POWER NETWORKS, Enel x, INC., General Electric Company, Limejump Energy Ltd., SCHNEIDER ELECTRIC SE, SIEMENS AG and SUNVERGE ENERGY INC. |
- Commercial and Industrial Consumers
- Energy Companies and Utilities
- Grid Operators and Aggregators
- Smart Home and Building Automation Companies
- Technology Providers
| By Technology: |
|
| By Vertical: |
|
| By Source: |
|
| By Region: |
|
- Global Virtual Power Plant Market Size (FY’2024-FY’2033)
- Overview of Global Virtual Power Plant Market
- Segmentation of Global Virtual Power Plant Market By Technology (Demand Response, Mixed Asset, Supply Side.)
- Segmentation of Global Virtual Power Plant Market By Vertical (Commercial, Industrial and Residential.)
- Segmentation of Global Virtual Power Plant Market By Source (Cogeneration, Renewable Energy and Storage.)
- Statistical Snap of Global Virtual Power Plant Market
- Expansion Analysis of Global Virtual Power Plant Market
- Problems and Obstacles in Global Virtual Power Plant Market
- Competitive Landscape in the Global Virtual Power Plant Market
- Impact of COVID-19 and Demonetization on Global Virtual Power Plant Market
- Details on Current Investment in Global Virtual Power Plant Market
- Competitive Analysis of Global Virtual Power Plant Market
- Prominent Players in the Global Virtual Power Plant Market
- SWOT Analysis of Global Virtual Power Plant Market
- Global Virtual Power Plant Market Future Outlook and Projections (FY’2024-FY’2033)
- Recommendations from Analyst
1.1. Scope of the report1.2. Market segment analysis
2.1. Research data source
2.1.1. Secondary Data2.1.2. Primary Data2.1.3. SPER’s internal database2.1.4. Premium insight from KOL’s
2.2. Market size estimation
2.2.1. Top-down and Bottom-up approach
2.3. Data triangulation
4.1. Driver, Restraint, Opportunity and Challenges analysis
4.1.1. Drivers4.1.2. Restraints4.1.3. Opportunities4.1.4. Challenges
4.2. COVID-19 Impacts of the Global Virtual Power Plant Market
5.1. SWOT Analysis
5.1.1. Strengths5.1.2. Weaknesses5.1.3. Opportunities5.1.4. Threats
5.2. PESTEL Analysis
5.2.1. Political Landscape5.2.2. Economic Landscape5.2.3. Social Landscape5.2.4. Technological Landscape5.2.5. Environmental Landscape5.2.6. Legal Landscape
5.3. PORTER’s Five Forces
5.3.1. Bargaining power of suppliers5.3.2. Bargaining power of buyers5.3.3. Threat of Substitute5.3.4. Threat of new entrant5.3.5. Competitive rivalry
5.4. Heat Map Analysis
6.1. Global Virtual Power Plant Market Manufacturing Base Distribution, Sales Area, Product Type6.2. Mergers & Acquisitions, Partnerships, Product Launch, and Collaboration in Virtual Power Plant Market
7.1. Global Virtual Power Plant Market Value Share and Forecast, By Technology, 2024-20337.2. Demand Response7.3. Mixed Asset7.4. Supply Side
8.1. Global Virtual Power Plant Market Value Share and Forecast, By Vertical, 2024-20338.2. Commercial8.3. Industrial8.4. Residential
9.1. Global Virtual Power Plant Market Value Share and Forecast, By Source, 2024-20339.2. Cogeneration9.3. Renewable Energy9.4. Storage
10.1. Global Virtual Power Plant Market Size and Market Share
11.1. Global Virtual Power Plant Market Size and Market Share By Technology (2020-2026)11.2. Global Virtual Power Plant Market Size and Market Share By Technology (2027-2033)
12.1. Global Virtual Power Plant Market Size and Market Share By Vertical (2020-2026)12.2. Global Virtual Power Plant Market Size and Market Share By Vertical (2027-2033)
13.1. Global Virtual Power Plant Market Size and Market Share By Source (2020-2026)13.2. Global Virtual Power Plant Market Size and Market Share By Source (2027-2033)
14.1. Global Virtual Power Plant Market Size and Market Share By Region (2020-2026)14.2. Global Virtual Power Plant Market Size and Market Share By Region (2027-2033)14.3. Asia-Pacific
14.3.1. Australia14.3.2. China14.3.3. India14.3.4. Japan14.3.5. South Korea14.3.6. Rest of Asia-Pacific
14.4. Europe
14.4.1. France14.4.2. Germany14.4.3. Italy14.4.4. Spain14.4.5. United Kingdom14.4.6. Rest of Europe
14.5. Middle East and Africa
14.5.1. Kingdom of Saudi Arabia14.5.2. United Arab Emirates14.5.3. Rest of Middle East & Africa
14.6. North America
14.6.1. Canada14.6.2. Mexico14.6.3. United States
14.7. Latin America
14.7.1. Argentina14.7.2. Brazil14.7.3. Rest of Latin America
15.1. AUTOGRID SYSTEM, INC.,
15.1.1. Company details15.1.2. Financial outlook15.1.3. Product summary15.1.4. Recent developments
15.2. AGL ENERGY LIMITED
15.2.1. Company details15.2.2. Financial outlook15.2.3. Product summary15.2.4. Recent developments
15.3. ENBALA POWER NETWORKS
15.3.1. Company details15.3.2. Financial outlook15.3.3. Product summary
15.3.4. Recent developments
15.4. Enel x, INC.,
15.4.1. Company details15.4.2. Financial outlook15.4.3. Product summary15.4.4. Recent developments
15.5. General Electric Company
15.5.1. Company details15.5.2. Financial outlook15.5.3. Product summary15.5.4. Recent developments
15.6. Limejump Energy Ltd.
15.6.1. Company details15.6.2. Financial outlook15.6.3. Product summary15.6.4. Recent developments
15.7. SUNVERGE ENERGY INC.,
15.7.1. Company details15.7.2. Financial outlook15.7.3. Product summary15.7.4. Recent developments
15.8. SIEMENS AG
15.8.1. Company details15.8.2. Financial outlook15.8.3. Product summary15.8.4. Recent developments
15.9. SCHNEIDER ELECTRIC SE
15.9.1. Company details15.9.2. Financial outlook15.9.3. Product summary15.9.4. Recent developments
15.10. Others
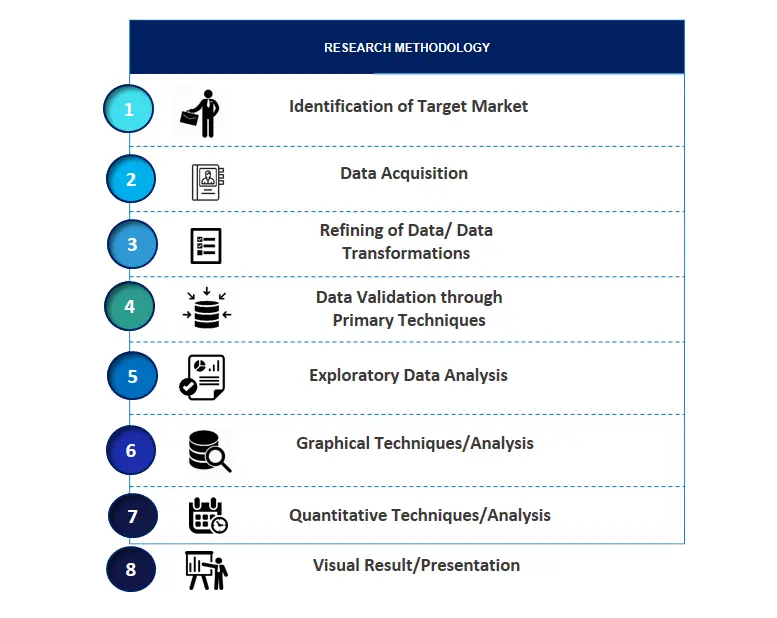
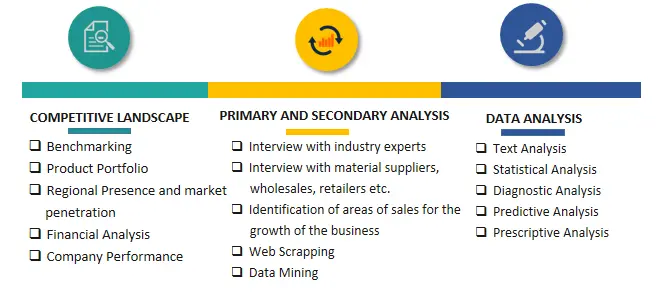
SPER Market Research’s methodology uses great emphasis on primary research to ensure that the market intelligence insights are up to date, reliable and accurate. Primary interviews are done with players involved in each phase of a supply chain to analyze the market forecasting. The secondary research method is used to help you fully understand how the future markets and the spending patterns look likes.
The report is based on in-depth qualitative and quantitative analysis of the Product Market. The quantitative analysis involves the application of various projection and sampling techniques. The qualitative analysis involves primary interviews, surveys, and vendor briefings. The data gathered as a result of these processes are validated through experts opinion. Our research methodology entails an ideal mixture of primary and secondary initiatives.


Frequently Asked Questions About This Report
PLACE AN ORDER
Year End Discount
Sample Report
Pre-Purchase Inquiry
NEED CUSTOMIZATION?
Request CustomizationCALL OR EMAIL US
100% Secure Payment


Related Reports
Our Global Clients
Our data-driven insights have influenced the strategy of 200+ reputed companies across the globe.


