

United States Computed Tomography Market Growth, Size, Trends, Demand and Future Outlook
United States Computed Tomography Market Size- By Type, By Application, By End User- Regional Outlook, Competitive Strategies and Segment Forecast to 2033
| Published: Sep-2024 | Report ID: MEDE2443 | Pages: 1 - 108 | Formats*: |
| Category : Medical Devices | |||
- A modular computed tomography (CT) system assembly patent was awarded to Xoran Technologies, an American business, in June 2022. This revolutionary cone beam CT configuration, along with our twenty and counting active patents, creates new opportunities. This breakthrough is just the beginning of Xoran's next generation of point-of-care (POC) imaging devices.
- Samsung Electronics subsidiary NeuroLogica Corp. received 510(k) approval for its OmniTom Elite in March 2022. With OmniTom Elite, point-of-care CT may be administered with flexible, real-time mobile imaging, eliminating the need to move critical patients to another imaging department.
| Report Metric | Details |
| Market size available for years | 2020-2033 |
| Base year considered | 2023 |
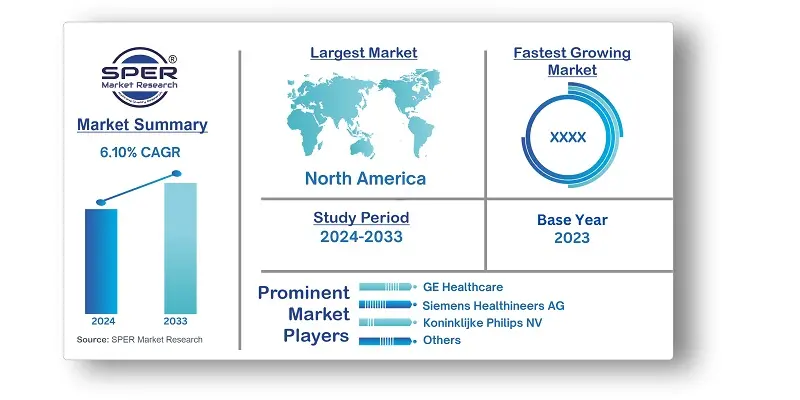
| Forecast period | 2024-2033 |
| Segments covered | By Type, By Application, By End User. |
| Regions covered | Eastern Region, Western Region, Northern Region, Southern Region |
| Companies Covered | Canon Medical Systems Corporation (Toshiba Corporation), Carestream Health, Fujifilm Holdings Corporation, GE Healthcare, Koning Corporation, Koninklijke Philips NV, Neusoft Medical Systems Co. Ltd, Planmeca Group (Planmed OY), Samsung Electronics Co., Ltd., Siemens Healthineers AG, Stryker Corporation, Others. |
- Healthcare Providers
- Radiology Departments
- Diagnostic Imaging Centers
- Hospitals
- Research Institutions
- Medical Equipment Manufacturers
- Insurance Companies
- Patients
- Healthcare Policymakers
| By Type: |
|
| By Application: |
|
| By End User: |
|
- United States Computed Tomography Market Size (FY’2024-FY’2033)
- Overview of United States Computed Tomography Market
- Segmentation of United States Computed Tomography Market By Type (Low Slice, Medium Slice, High Slice)
- Segmentation of United States Computed Tomography Market By Application (Oncology, Neurology, Cardiovascular, Musculoskeletal, Others)
- Segmentation of United States Computed Tomography Market By End User (Hospitals, Diagnostic Centers, Others)
- Expansion Analysis of United States Computed Tomography Market
- Problems and Obstacles in United States Computed Tomography Market
- Competitive Landscape in the United States Computed Tomography Market
- Impact of COVID-19 and Demonetization on United States Computed Tomography Market
- Details on Current Investment in United States Computed Tomography Market
- Competitive Analysis of United States Computed Tomography Market
- Prominent Players in the United States Computed Tomography Market
- SWOT Analysis of United States Computed Tomography Market
- United States Computed Tomography Market Future Outlook and Projections (FY’2024-FY’2033)
- Recommendations from Analyst
1.1. Scope of the report1.2. Market segment analysis
2.1. Research data source
2.1.1. Secondary Data2.1.2. Primary Data2.1.3. SPER’s internal database2.1.4. Premium insight from KOL’s
2.2. Market size estimation
2.2.1. Top-down and Bottom-up approach
2.3. Data triangulation
4.1. Driver, Restraint, Opportunity and Challenges analysis
4.1.1. Drivers4.1.2. Restraints4.1.3. Opportunities4.1.4. Challenges
4.2. COVID-19 Impacts of the United States Computed Tomography Market
5.1. SWOT Analysis
5.1.1. Strengths5.1.2. Weaknesses5.1.3. Opportunities5.1.4. Threats
5.2. PESTEL Analysis
5.2.1. Political Landscape5.2.2. Economic Landscape5.2.3. Social Landscape5.2.4. Technological Landscape5.2.5. Environmental Landscape5.2.6. Legal Landscape
5.3. PORTER’s Five Forces
5.3.1. Bargaining power of suppliers5.3.2. Bargaining power of buyers5.3.3. Threat of Substitute5.3.4. Threat of new entrant5.3.5. Competitive rivalry
5.4. Heat Map Analysis
6.1. United States Computed Tomography Market Manufacturing Base Distribution, Sales Area, Product Type6.2. Mergers & Acquisitions, Partnerships, Product Launch, and Collaboration in United States Computed Tomography Market
7.1. United States Computed Tomography Market Size, Share and Forecast, By Type, 2020-20267.2. United States Computed Tomography Market Size, Share and Forecast, By Type, 2027-20337.3. Low Slice7.4. Medium Slice7.5. High Slice
8.1. United States Computed Tomography Market Size, Share and Forecast, By Application, 2020-20268.2. United States Computed Tomography Market Size, Share and Forecast, By Application, 2027-20338.3. Oncology8.4. Neurology8.5. Cardiovascular8.6. Musculoskeletal8.7. Others
9.1. United States Computed Tomography Market Size, Share and Forecast, By End User, 2020-20269.2. United States Computed Tomography Market Size, Share and Forecast, By End User, 2027-20339.3. Hospitals9.4. Diagnostic Centers9.5. Others
10.1. United States Computed Tomography Market Size and Market Share
11.1. United States Computed Tomography Market Size and Market Share By Region (2020-2026)11.2. United States Computed Tomography Market Size and Market Share By Region (2027-2033)11.3. Eastern Region11.4. Western Region11.5. Northern Region11.6. Southern Region
12.1. Canon Medical Systems Corporation (Toshiba Corporation)
12.1.1. Company details12.1.2. Financial outlook12.1.3. Product summary12.1.4. Recent developments
12.2. Carestream Health
12.2.1. Company details12.2.2. Financial outlook12.2.3. Product summary12.2.4. Recent developments
12.3. Fujifilm Holdings Corporation
12.3.1. Company details12.3.2. Financial outlook12.3.3. Product summary12.3.4. Recent developments
12.4. GE Healthcare
12.4.1. Company details12.4.2. Financial outlook12.4.3. Product summary12.4.4. Recent developments
12.5. Koning corporation
12.5.1. Company details12.5.2. Financial outlook12.5.3. Product summary12.5.4. Recent developments
12.6. Koninklijke Philips NV
12.6.1. Company details12.6.2. Financial outlook12.6.3. Product summary12.6.4. Recent developments
12.7. Neusoft Medical Systems Co. Ltd
12.7.1. Company details12.7.2. Financial outlook12.7.3. Product summary12.7.4. Recent developments
12.8. Planmeca Group (Planmed OY)
12.8.1. Company details12.8.2. Financial outlook12.8.3. Product summary12.8.4. Recent developments
12.9. Samsung Electronics Co., Ltd.
12.9.1. Company details12.9.2. Financial outlook12.9.3. Product summary12.9.4. Recent developments
12.10. Siemens Healthineers AG
12.10.1. Company details12.10.2. Financial outlook12.10.3. Product summary12.10.4. Recent developments
12.11. Stryker Corporation
12.11.1. Company details12.11.2. Financial outlook12.11.3. Product summary12.11.4. Recent developments
12.12. Others
SPER Market Research’s methodology uses great emphasis on primary research to ensure that the market intelligence insights are up to date, reliable and accurate. Primary interviews are done with players involved in each phase of a supply chain to analyze the market forecasting. The secondary research method is used to help you fully understand how the future markets and the spending patterns look likes.
The report is based on in-depth qualitative and quantitative analysis of the Product Market. The quantitative analysis involves the application of various projection and sampling techniques. The qualitative analysis involves primary interviews, surveys, and vendor briefings. The data gathered as a result of these processes are validated through experts opinion. Our research methodology entails an ideal mixture of primary and secondary initiatives.


Frequently Asked Questions About This Report
PLACE AN ORDER
Year End Discount
Sample Report
Pre-Purchase Inquiry
NEED CUSTOMIZATION?
Request CustomizationCALL OR EMAIL US
100% Secure Payment


Related Reports
Have a glance of the Report

Our Global Clients
Our data-driven insights have influenced the strategy of 200+ reputed companies across the globe.