
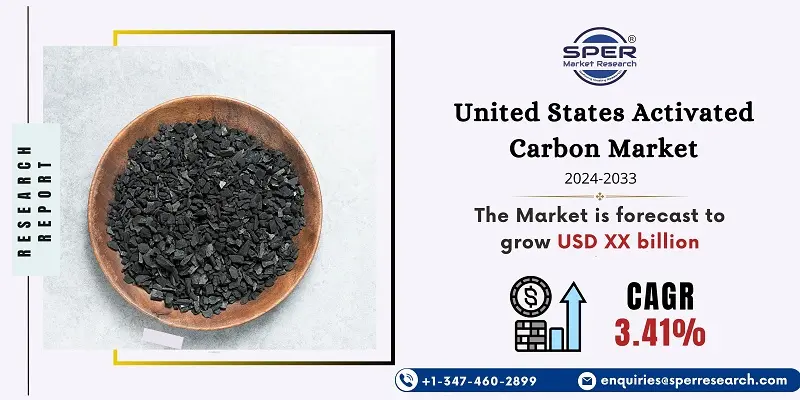
United States Activated Carbon Market Growth, Trends, Size, Demand, Share and Future Outlook
United States Activated Carbon Market Size- By Product, By Raw Material Type, By Phase, By End User and Region, Competitive Strategies and Segment Forecast to 2033
| Published: Jul-2024 | Report ID: CHEM2470 | Pages: 1 - 107 | Formats*: |
| Category : Chemical & Materials | |||
- April 2021; Cabot Organization reported that it had extended its NORIT enacted carbon product offering with another initiated carbon item for the expulsion of mercury from gaseous petrol. The item is called NORIT CNR 1200.
- December 2021; Jacobi Carbons declared that it had obtained the resources of PICA Gathering. PICA Gathering is a maker of enacted carbon items for the air and water cleaning markets.
| Report Metric | Details |
| Market size available for years | 2020-2033 |
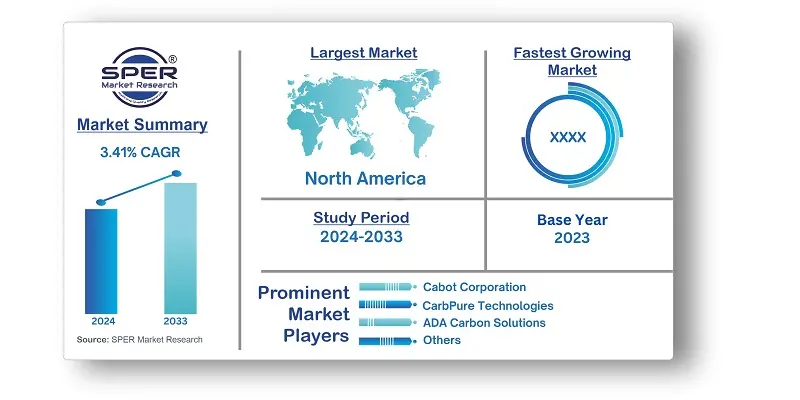
| Base year considered | 2023 |
| Forecast period | 2024-2033 |
| Segments covered | By Product, By Raw Material Type, By Phase, By End-User |
| Regions covered | California, Texas, Florida, New York, Illinois, Pennsylvania, Ohio, North Carolina. |
| Companies Covered | ADA Carbon Solutions, Cabot Corporation, California Carbon Co. Inc, CarbPure Technologies, CarbUSA, Carbo Tech AC GmbH, Carbon Activated Corporation, Datong Coal Jinding Activated Carbon Co., Evoqua Water Technologies LLC, Jaxon Filtration. |
- Water Treatment Facilities
- Environmental Engineering Firms
- Industrial Manufacturers
- Air Purification Systems
- Regulatory Agencies and Compliance Officers
- Research and Development (R&D) Departments
- Distributors and Suppliers
- Investors and Financial Institutions
| By Product: |
|
| By Raw Material Type: |
|
| By Phase: |
|
| By End-User: |
|
- United States Activated Carbon Market Size (FY’2024-FY’2033)
- Overview of United States Activated Carbon Market
- Segmentation of United States Activated Carbon Market by Product (Powdered Activated Carbons, Granular Activated Carbons, Extruded or Pelletized Activated Carbon, Pellet Shaped, Bead Shaped, Impregnated Carbon, Polymer Coated Carbon, and Others)
- Segmentation of United States Activated Carbon Market by Raw Material Type (Coal Based, Coconut Shell Based, Wood Based, Petroleum Pitch and Others)
- Segmentation of United States Activated Carbon Market by Phase (Liquid Phase and Gas Phase)
- Segmentation of United States Activated Carbon Market by End-User (Food & Beverage Processing, Pharmaceutical & Medical, Automotive, Air Purification, Gold Treatment, Respirators, Solvency Recover, Mining, Industrial Chemicals, and others)
- Statistical Snap of United States Activated Carbon Market
- Expansion Analysis of United States Activated Carbon Market
- Problems and Obstacles in United States Activated Carbon Market
- Competitive Landscape in the United States Activated Carbon Market
- Impact of COVID-19 and Demonetization on United States Activated Carbon Market
- Details on Current Investment in United States Activated Carbon Market
- Competitive Analysis of United States Activated Carbon Market
- Prominent Players in the United States Activated Carbon Market
- SWOT Analysis of United States Activated Carbon Market
- United States Activated Carbon Market Future Outlook and Projections (FY’2024-FY’2033)
- Recommendations from Analyst
1.1. Scope of the report1.2. Market segment analysis
2.1. Research data source
2.1.1. Secondary Data2.1.2. Primary Data2.1.3. SPER’s internal database2.1.4. Premium insight from KOL’s
2.2. Market size estimation
2.2.1. Top-down and Bottom-up approach
2.3. Data triangulation
4.1. Driver, Restraint, Opportunity and Challenges analysis
4.1.1. Drivers4.1.2. Restraints4.1.3. Opportunities4.1.4. Challenges
4.2. COVID-19 Impacts of the United States Activated Carbon Market
5.1. SWOT Analysis
5.1.1. Strengths5.1.2. Weaknesses5.1.3. Opportunities5.1.4. Threats
5.2. PESTEL Analysis
5.2.1. Political Landscape5.2.2. Economic Landscape5.2.3. Social Landscape5.2.4. Technological Landscape5.2.5. Environmental Landscape5.2.6. Legal Landscape
5.3. PORTER’s Five Forces
5.3.1. Bargaining power of suppliers5.3.2. Bargaining power of buyers5.3.3. Threat of Substitute5.3.4. Threat of new entrant5.3.5. Competitive rivalry
5.4. Heat Map Analysis
6.1. United States Activated Carbon Market Manufacturing Base Distribution, Sales Area, Product Type6.2. Mergers & Acquisitions, Partnerships, Product Launch, and Collaboration in United States Activated Carbon Market
7.1. United States Activated Carbon Market Size, Share and Forecast, By Product, 2020-20267.2. United States Activated Carbon Market Size, Share and Forecast, By Product, 2027-20337.3. Powdered Activated Carbons7.4. Granular Activated Carbons7.5. Extruded or Pelletized Activated Carbon7.6. Pellet Shaped7.7. Bead Shaped7.8. Impregnated Carbon7.9. Polymer Coated Carbon7.10. Others
8.1. United States Activated Carbon Market Size, Share and Forecast, By Raw Material Type, 2020-20268.2. United States Activated Carbon Market Size, Share and Forecast, By Raw Material Type, 2027-20338.3. Coal Based8.4. Coconut Shell Based8.5. Wood Based8.6. Petroleum Pitch8.7. Others
9.1. United States Activated Carbon Market Size, Share and Forecast, By Phase, 2020-20269.2. United States Activated Carbon Market Size, Share and Forecast, By Phase, 2027-20339.3. Liquid Phase9.4. Gas Phase
10.1. United States Activated Carbon Market Size, Share and Forecast, End-User, 2020-202610.2. United States Activated Carbon Market Size, Share and Forecast, By End-User, 2027-203310.3. Food & Beverage Processing10.4. Pharmaceutical & Medical, Automotive10.5. Air Purification10.6. Gold Treatment10.7. Respirators10.8. Solvency Recover10.9. Mining10.10. Industrial Chemicals10.11. Gas Phase10.12. others
11.1. United States Activated Carbon Market Size and Market Share
12.1. United States Activated Carbon Market Size and Market Share By Region (2020-2026)12.2. United States Activated Carbon Market Size and Market Share By Region (2027-2033)12.3. California12.4. Texas12.5. Florida12.6. New York12.7. Illinois12.8. Pennsylvania12.9. Ohio12.10. North Carolina12.11. Rest of United States
13.1. CARBPURE TECHNOLOGIES
13.1.1. Company details13.1.2. Financial outlook13.1.3. Product summary13.1.4. Recent developments
13.2. CARBUSA
13.2.1. Company details13.2.2. Financial outlook13.2.3. Product summary13.2.4. Recent developments
13.3. CARBO TECH AC GMBH
13.3.1. Company details13.3.2. Financial outlook13.3.3. Product summary13.3.4. Recent developments
13.4. CARBON ACTIVATED CORPORATION
13.4.1. Company details13.4.2. Financial outlook13.4.3. Product summary13.4.4. Recent developments
13.5. DATONG COAL JINDING ACTIVATED CARBON CO.
13.5.1. Company details13.5.2. Financial outlook13.5.3. Product summary13.5.4. Recent developments
13.6. EVOQUA WATER TECHNOLOGIES LLC
13.6.1. Company details13.6.2. Financial outlook13.6.3. Product summary13.6.4. Recent developments
13.7. JAXON FILTRATION
13.7.1. Company details13.7.2. Financial outlook13.7.3. Product summary13.7.4. Recent developments
13.8. Others
SPER Market Research’s methodology uses great emphasis on primary research to ensure that the market intelligence insights are up to date, reliable and accurate. Primary interviews are done with players involved in each phase of a supply chain to analyze the market forecasting. The secondary research method is used to help you fully understand how the future markets and the spending patterns look likes.
The report is based on in-depth qualitative and quantitative analysis of the Product Market. The quantitative analysis involves the application of various projection and sampling techniques. The qualitative analysis involves primary interviews, surveys, and vendor briefings. The data gathered as a result of these processes are validated through experts opinion. Our research methodology entails an ideal mixture of primary and secondary initiatives.


Frequently Asked Questions About This Report
PLACE AN ORDER
Year End Discount
Sample Report
Pre-Purchase Inquiry
NEED CUSTOMIZATION?
Request CustomizationCALL OR EMAIL US
100% Secure Payment


Related Reports
Have a glance of the Report

Our Global Clients
Our data-driven insights have influenced the strategy of 200+ reputed companies across the globe.